

Are the Bears Finished Yet? Recapping News, Data, & Trades
Short answer: Not really

A lot has happened in the markets this month! I booked over 100% profits on a summer trade, markets are diving to lows of the year while treasury yields skyrocket, and there’s plenty of news to cover. It’s gonna be a long post:
The FED: SEP + “Difficult Correction”!
There was a 18% chance of a 100bps rate hike going into the the 9/21 announcement, but the FED delivered the widely expected 75bps. If anything that should have sent stocks higher on relief, but it came with other news that was not priced in by most investors. Let’s start with the SEP (Summary of Economic Projections).

Here we see updated projections on GDP, Unemployment, PCE inflation, Core Inflation, and the Fed Funds Rate, and how it’s changed since the last one in June. Also, this is the first report to include projections for 2025.
This SEP shifted significantly in a bearish direction. I believe they are more realistic than prior releases, but the Fed has been behind the curve for a long time (remember “transitory inflation”?) and they have virtually no track record of predicting recessions. For a variety of reasons, government always tends to be a cheerleader when realism would be more helpful in the long run. Consider the ugly 0.2% GDP increase they expect 2022 to end up with.
Q1: -1.6%
Q2: -0.6%
Q3: +0.3% (projected)
Q4: ??
The Q3 projection has been falling rapidly, but if it holds as is, Q4 will have to come in around or above +1.9%. The more data we look at, the rosier this outlook seems.
The stock market sold off sharply on the initial announcement, then bounced back; it looked like yet another typical rate-raising green day, but Powell’s press conference reversed all that we he called for a housing correction!
Back in the June, he said “I’d say if you are a homebuyer, somebody or a young person looking to buy a home, you need a bit of a reset. We need to get back to a place where supply and demand are back together and where inflation is down low again, and mortgage rates are low again.” He was asked to clarify in this week’s conference:
“When I say reset, I’m not looking at a particular specific set of data. What I’m really saying is that we’ve had a time of a red-hot housing market all over the country, where famously houses were selling to the first buyer at 10% above the ask even before seeing the house. That kind of thing. So there was a big imbalance between supply and demand. Houses were going up at an unsustainable fast level. So the deceleration in housing prices that we’re seeing should help to bring prices more closely in line with rents and other housing market fundamentals. That is a good thing. For the longer term what we need is supply and demand to get better aligned so that housing prices go up at a reasonable level and at a reasonable pace and that people can afford houses again. We probably in the housing market have to go through a correction to get back to that place. There are also longer-run issues with the housing market. As you know, it is difficult to find lots now close enough to cities, so builders are having a hard time getting zoning and lots and workers and materials and things like that. But from a business cycle standpoint, this difficult [housing] correction should put the housing market back into better balance,” Powell told reporters on Wednesday.
Stocks immediately plunged 1% and continued selling off for the rest of the day. It’s rare to get something this straightforward from the Fed. The man with the most influence over the mortgage rates is in the process of forcing a correction. A “difficult correction” will be double digit percentage points in housing stats, you see the beginnings of it in all the data Redfin offers. Primary residences are typically the largest component of household wealth and their tremendous rise in value helps create a wealth effect where people think they have more money to spend, which affects a lot more in the economy than housing. However, unlike 2008, this doesn’t appear to be a housing centric bubble; it’s more of an everything bubble. Loan quality and home equity are better this time around.
Economic Data

FRED isn’t showing the latest rate hike yet, but needless to say this has been the steepest rise in the interest rate in some 40 years. Every single recession (gray shaded areas) was preceded by steady rate hikes. Yet the SEP still projects a soft landing. This time, you see, will be different. 🤣

Yields on all US Treasuries are rising substantially, reflecting a reduced confidence in the government and economy. Since around 1985, there has been a straight, downward sloping trend on yields, and for the first time this trendline has been broken decisively.

The yield curve on the Treasuries is something to behold. Normally you want higher rates when your money is tied up for longer periods of time. When it slopes down, this is called inversion and it reflects relative short term drops in confidence, and is a reliable recession indicator. The trend has been steepening on the most watched comparison:
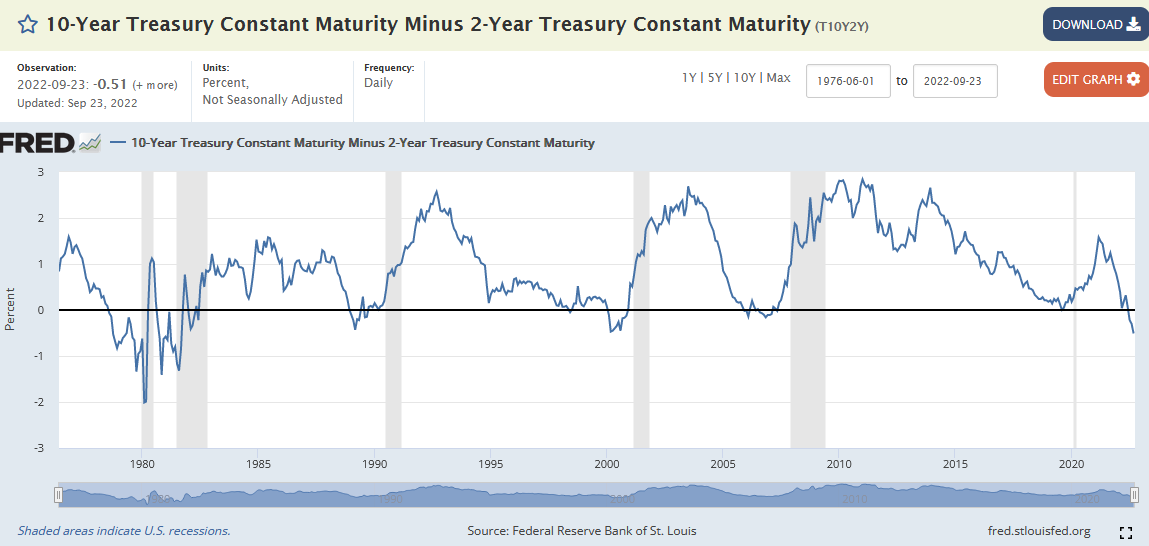
We will get a fresh set of monthly money supply numbers this coming Tuesday. I consider it one of the strongest indicators of whether the stock market can sustain a boom. We will have to watch this closely but it still looks to very much be in favor of the bears.

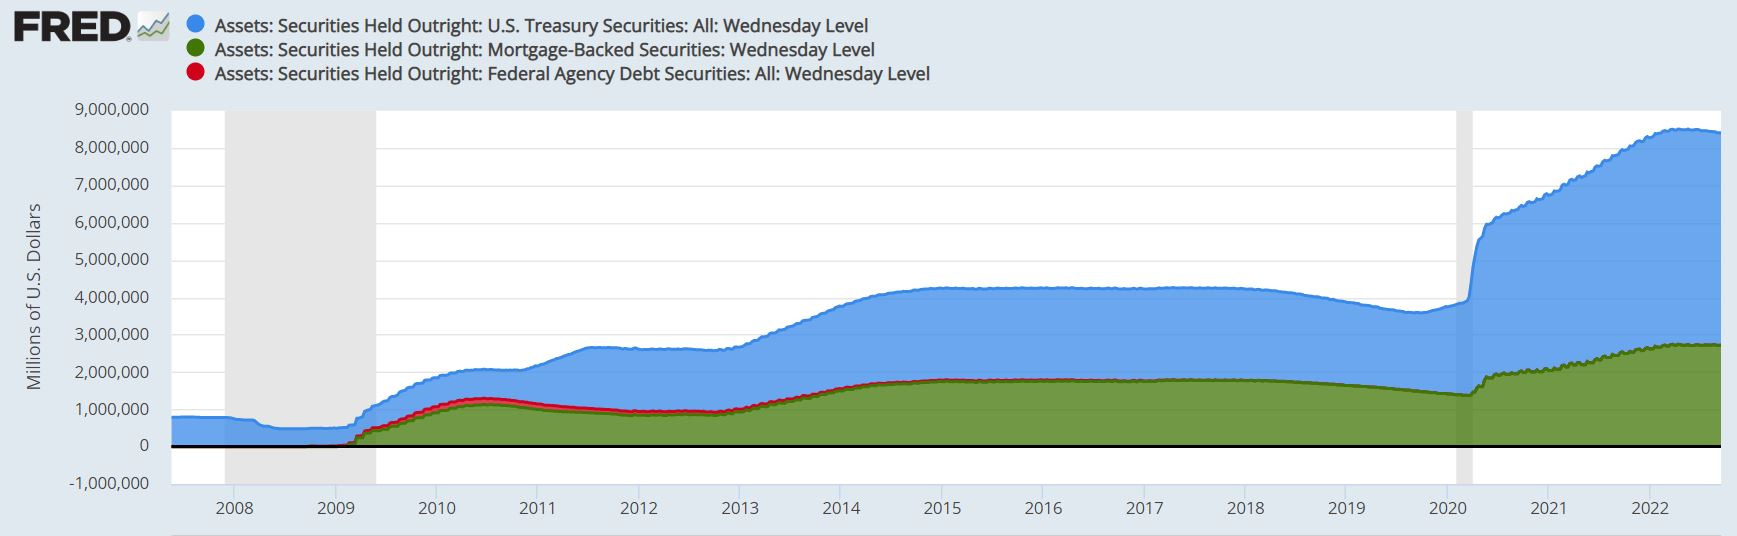
On the Quantitative Tightening front, the Fed was set to reduce treasury and mortgage backed securities on the Fed balance sheet by a cap of $47.5 billion per month from June to August and then double that starting in September. Out of $142.5 billion maximum they could have reduced by the end of August, they did ~$74 billion. It’s a slow start, but we need to see more data. I expect them to follow through with these reductions for some time, but historically they revert back to QE before substantial progress is made. In a post pandemic world with 40 year high inflation that trend may not hold. Either way, this sucks up liquidity and for now is another bearish catalyst.
Margin and free cash balances in brokerage accounts continue to slowly decline as well, which means less money chasing stocks.
S&P 500 Chart

There is a lot going on in this chart of the SPY (S&P 500 ETF). It’s as good of a representation of the broad market as any. To keep it simple, here we have a 20-year chart with each candle representing one week. Currently, we are catching support on the exponential 200-week moving average like we did in June. Are we bouncing off the June bottom and headed back to $380 to close that gap, touching the simple 200-week moving average at $360, or ready for a panic leg down to the bottom of the channel at $340 (-8%)? I would note on the daily chart the RSI is oversold, reading less than 29.
Trading Update: Bearish Bet Pays Off
On 9/22 I liquidated all the TQQQ puts I purchased in August, since they had exceeded 100% ROI, expiration fell under 3 months, and I wanted to take a few days to reassess the markets.
TQQQ Put $35 Strike 1/20/23 Exp.: +101.6%
TQQQ Put $37.5 Strike 1/20/23 Exp.: +123%
Total Average Return: +109.1%
In early September, I thought the market would bounce on light news and previous support levels, so I briefly held an SQQQ Put from the 2nd through the 9th; it was nearly perfect timing in hindsight.
SQQQ Put $50 Strike 1/20/23 Exp. : +17.6%
That’s outstanding performance, and feels like beginner’s luck. As mentioned previously, swing trading is what I’ve had the least practice on. However, as previous posts show, it was a well researched, relatively low risk trade, which isn’t luck. Writing these posts helps me organize my research and increase confidence in making these trades. As always, don’t copy my work without doing your own research and risk-assessment.
Summary
What’s next? The data I’ve viewed, most of it recapped here, remains firmly bearish. I don’t see any reason for us to hold onto the June 17th bottom when so many 40 year trends are being broken and the Fed is so far holding firm to a inflation fighting stance. Money supply isn’t blowing air back into the bubble.
On the very short term direction is hard to tell. I lean bullish for lack of scheduled economic news in the next few days, the oversold indicators flashing, and the VIX (volatility index) trapped under a downward sloping line. I haven’t reentered new positions yet. I need a bit more time to digest what’s going on and see the market moves in the next few days. I also want to look at other leveraged ETF options before automatically going back to TQQQ/SQQQ.
The bears aren’t done, but they might need a break.
Jerome Powell wants to centrally plan many aspects of the economy. He has an exceptionally dangerous level of hubris.