

An Investing Strategy to Make Cash from Trash
A Leveraged ETF Deep Dive

*Disclaimer: This post discusses an investment strategy but is not a personalized investment recommendation. Readers are responsible for their own research and risk assessment decisions when investing.*
In previous posts I have shared, from start to finish, my bearish trades on the undoing of the summer rally through puts on leveraged bull 3x ETF’s. Here I will begin exploring a different strategy that can be used to trade them profitably.
First, it’s important to give credit where it’s due. I had not noticed any of this until I started reading David’s work on it in the Live Better Now Substack. I suggest giving him a follow, as he has been fine tuning it far longer than me and also has a pretty apt name for his bidirectional leveraged ETF plays: The Sinking Ship Portfolio.
Investopedia covers the mechanics behind these ETFs pretty well here. It’s like an ETF with theta decay. They are always shedding some value overtime due to the types of financial instruments being used to yield leveraged returns. The higher the leverage, the more value is lost over time. In this post, we will focus exclusively on the 3x ETFs, where a bullish ETF yields 300% on the underlying benchmark asset’s daily performance, and the bearish version yields -300%.

This value shed becomes overwhelmingly evident when you track the sum of an equivalent bullish and bearish ETF over an extended time frame. It’s astonishing when you look at how much value is lost over the last decade in these things. And the amazing thing is, we can buy options (puts) to bet on that happening. Caution is warranted, however: the data shows this strategy typically will require a multi-year time horizon, as there are many instances where these ETFs increase in price for extended periods in their erratic moves towards zero.
In the following spreadsheet, I have laid out all of the Bull/Bear combinations from both Direxion and ProShares, with prices current as of the close last week, 12/10/22. The average age of these ETFs are about 12 years. In the 7th column, the combined inception price of the Bull/Bear ETF is a ridiculously large number. No shares traded near those prices: instead, over the years, there have been countless stock splits and reverse splits to keep them trading generally in a range of $10 to $200 real-time. Nevertheless, that is actually how much value has been lost: over 99% on average, since inception.

(Click to expand.)
I included a rough midpoint dated from the opening price on the first trading day of 2016, to see how the returns compared. Nothing special about this date otherwise.
While the spreadsheet is a good starting point, as they say, a picture is worth a thousand words; let’s get to the charts. I’ve combined both the bull and the bear 3x ETFs on a single chart simply by typing “TICKER+TICKER” where you normally insert the ticker you want to search.
Let’s start with the most traded combination, "TQQQ+SQQQ”, with the time frame set to weekly for the candlesticks, and since inception to present (2010-2022)
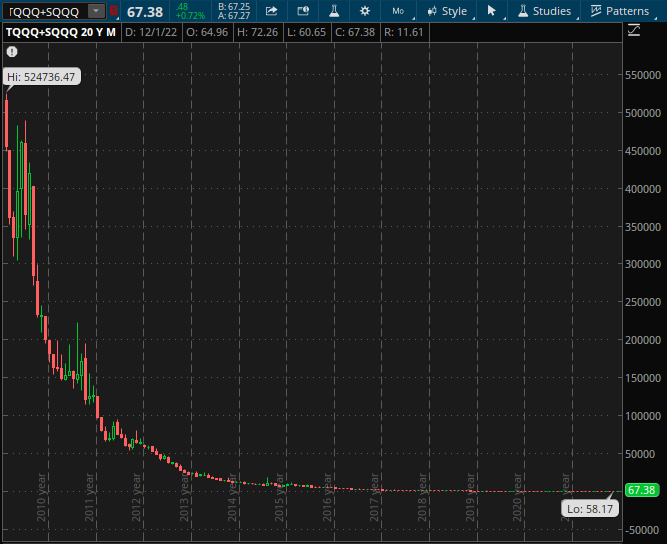
Ouch. That’s impossible to read after the first few years. We’re going to have to change this chart from a standard scale to a logarithmic scale so we can see clearly what’s going on through the whole time:

Isn’t it beautiful? It’s nearly a straight line here, but remember, in reality, it’s parabolic. Nevertheless, it allows us to see it’s not a perfectly straight line, and that’s where this will get a bit tricky. First, let’s consider all the other ETF combos, conveniently condensed into a GIF:

Each is shown for the full time frame since inception. The orange line is a 104 week simple moving average (2 years). At the bottom, we have a standard weekly RSI (Relative Strength Index). Here’s some initial observations:
Clearly, the fundamental price decay is visible over time, without exception.
On an average, over any two year period (orange line), it has always trended down with three exceptions: the Chinese ETF (briefly) and the US Treasury ETFs. I suggest ignoring or at least being more cautious about any play with these lower volume ETFs.
It’s rare for the price to top the two year average, and when it does, it’s brief.
The RSI, used to show oversold and overbought conditions, reads consistently oversold and struggles to run much higher than 50, the normal midpoint. At anytime it hits 60 or higher, within the next two years the ETF pair is priced much lower - with almost no exceptions (again, mainly Treasury and International - where you may need to ask for a 70-75 RSI for that to hold true).
I’m focused on two year time frames, because options plays have a maximum time frame of 2 years and 3 months at best, when you catch them rolling out the January dates for 3 calendar years forward every September. Not all equities get options that far out, but many do.
Options have their own theta decay, but it’s less pronounced on long dated contracts (a.k.a. LEAPS). A strategy of buying puts on these bull/bear combos will likely result in needing to sell and buy further out expirations occasionally. If the trade works out well, one of the puts may be extremely profitable, while the other yeilds low profit or even a loss. The goal is merely to have the combination of puts turn a profit.
I knew from glancing at this before that the bull/bear combos don’t go down in a straight line. Moving to logarithmic scale really helps visualize this over time. So what signals a good buying opportunity? Of course, there are unrelated reasons to make a one sided trade as I did before, but taking a bidirectional trade, 50/50 split against the ETF combo, is completely different. That’s just trying to profit off the trashiness of these things, and whatever else helps move their price down.
It looks like the best strategy is to wait for the weekly RSI to reach at least 60. To play it safe - and maybe even take advantage of long term capital gains treatment - stick to the longest dated options contracts. Look at closing the trade within a few months or maybe up to just over a year, and either rolling to further out dates or wait for the RSI to heat up again. With the occasional price spikes and the theta decay of your puts I certainly don’t see much reason to risk holding beyond a year.
Every single combination, on the weekly chart, has an RSI under 50 right now. A few are near 45. Some are quite a distance below their 2 year simple moving average. I could probably turn a profit on a few of these but I will be more than happy to wait for a 60+ RSI. LEAPS are expensive, after all!
Appendix:
Here are the US Sector Bullish 3x ETF’s that have no corresponding bearish counterpart. Useful to consider if you wanted to short real estate, for example.

Alright, you and David have convinced me to take the plunge. I'll try it out once the RSI and VIX are in a favorable position.