

Why the Summer Stock Rally Won't Last
Don't fight the Fed, and other stuff

We have seen two major rallies in the 2022 bear market. A simple technical analysis shows one big downard channel for the entire year, and the NASDAQ and S&P 500 have just about hit the top of the channel in this latest rally, something we haven’t seen since March.
SPY ETF (S & P 500):

QQQ ETF (NASDAQ):

(Daily charts over last 9 months. Lines: gray is 200-day exponential moving average; blue is 200-day simple moving average; red are the trendlines/channels; and black are unfilled gaps)
Short term, we can use technical analysis of the charts to understand likley price action. This rally is approaching an overextended zone with the RSI heating up to the upper 60’s on both charts (not shown). We are essentially already at the main channel/trendline resistance that has held up all year, and both are close to the 200-day moving averages that will be resistance as well. Finally, we have downside price gaps in the charts, and while they are pretty far away (>10%), they do tend to eventually fill, especially on major indecies. My verdict: we are due for a pullback soon.
But how much of a pullback? Unfortunately for the bulls, there are a lot of fundamental problems that suggest we have a lot more downside.
First up, money supply growth has completely stalled out. This is the big one. An inflationary boom can only continue by increasing the rate of inflation. Not only has the rate of growth decreased, we have seen a slight drift down. Meanwhile, Fed monetary policy remains hawkish in both word and action.

Investors are looking for any sign that Powell might chill on the interest rate hikes. Just the fact that he said going forward they would make a decision on a meeting-to-meeting basis rather than give forward guidance helped fuel the rally in July. As I am editing this, the jobs report just came out very hot with twice as many jobs added as expected, which signals to the Fed a need for continued tightening, so stocks turned down sharply by 1%. Regardless of these short term moves, the big picture remains: there is no fuel to sustain the boom until the money supply starts booming again.
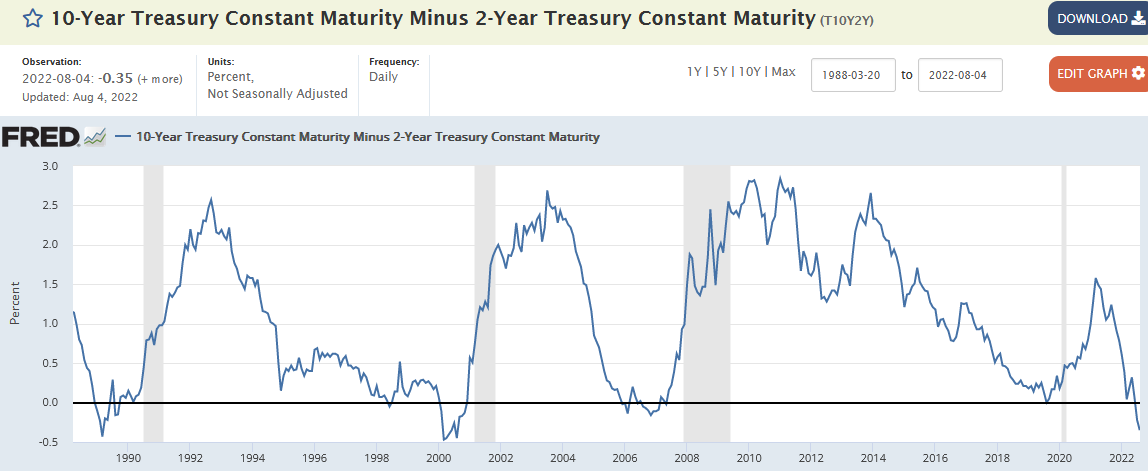
The yeild curve continues to flash warnings of recession, with not only the famous 2 vs. 10 year yeild invereted, but also nearly every other time frame combination possible:

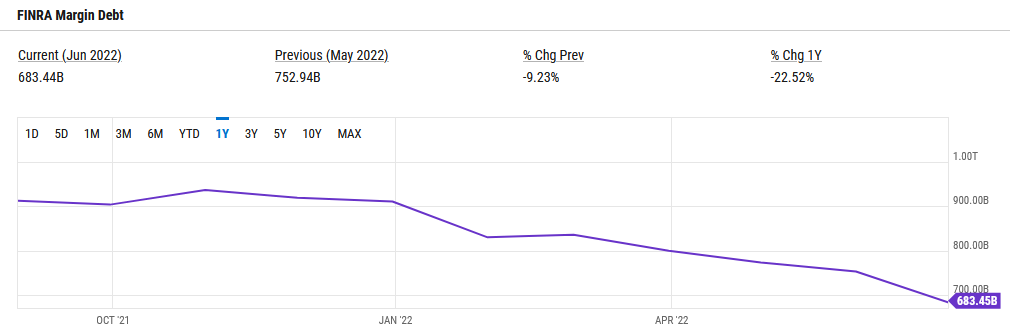
Margin debt also continues to decline, signalling a reduced appitatie for risk.
For lack of time, I’ll have to stop there. To me, it looks like a high risk environemnt to go long on the general stock market. I have started a small bearish bet this week on the NASDAQ via long-dated TQQQ puts and plan to add to the position slowly. We’ll revisit this in an upcoming post.
We live in a very strange world, in which positive news about the economy is seen as a negative.