
A Great Barrier Holding the Stock Market Back Could Break Soon
A Great Barrier Holding the Stock Market Back Could Break Soon
It's Still Not Time to Become a Raging Bull

January 4, 2022.
That’s the day the S&P 500 peaked. Tech heavy NASDAQ served as a leading indicator, peaking the November before. It’s all been downhill since - in a straight line. One of the most basic charting analysis tools is trend lines. Like all technicals, they ultimately work because everyone knows everyone else is watching them. The epic downward sloping line of 2022 has been tested 6 times now on the S&P 500. Not once has a single day closed above this line.
With the third trading week in January now complete, it looks like we’re setting up for a 7th test. Despite recession concerns and lack of money printing to fuel another bubble, there is no reason to think this trend line must keep holding much longer. If it breaks with daily and weekly closes to the upside, a lot of buying will be unleashed… but we’re not going back to all time highs any time soon in this era of tightening.
I didn’t draw it but there is also a very clean trend line from the October 13th bottom up through all the main lows since on the S&P 500. This forms a wedge that terminates in about a month. A decisive move up or down should follow this consolidation, and we have plenty of fundamental catalysts to trigger that, in the form of earnings season and the FOMC meeting ending February 1st.
As noted in my last post, For Investors, Cash is Not Trash, and More, I was and am still sitting on high cash levels right now waiting for the right opportunity. When we get a breakout from this wedge, I plan to ride the trend - for a short time. I expect a more range bound market for quite awhile absent surprise developments in geopolitics or central bank tinkering. While I’m hoping for 50 basis points again, this Fed has been extremely consistent channeling their moves ahead of time, so I am expecting a quarter point wins out. Absurdly, markets are now pricing in a chance of zero hike while dropping a half point off the betting table completely.

Dollar Dips, Gold Rips
The US Dollar had a tremendous run as the Federal Reserve got ahead of all the other major central banks in raising rates from the insanity of ZIRP. Last week closed at exactly the 50% retracement mark. Weekly charts:
Gold is getting really overbought here in the short term. I am watching the leveraged gold ETFs for a put buying opportunity. Unfortunately only a 2x leverage ETF is available, instead of 3x; but the same principles apply, though a bit more subdued. My number one indicator for these, weekly RSI, is getting very close to tripping my pre-set alerts for the 70 range. For UGL, the 2x bull gold ETF, it reads at 67.3. The bull/bear combo UGL+GLL comes in at 66.5.
Based on the ranges of this move so far, I think this at best becomes a 2-3 week trade, if you only trade puts on the UGL, as gold is very likely to test all time highs this year and I do not want to stand in the way of that. A combo can be held much longer. However, if the dollar bounces at the key level it just reached, we may not get much of an opportunity here anyway, but it’s definitely worth watching.

(Weekly chart. Click to enlarge.)
Capital Flight to the US
Not only do we have our own government’s manipulations and distortions to figure out when trading US stocks, but we also have the effects of foreign governments to make things even more complicated. As inefficient, bloated, and destructive as our own massive government is, there is still a lot of good things to say about the United States as a place to do business verses some of the nonsense that occurs overseas. Just consider how the big Western players are reacting to inflation and who looks like the cleanest shirt in the hamper here:

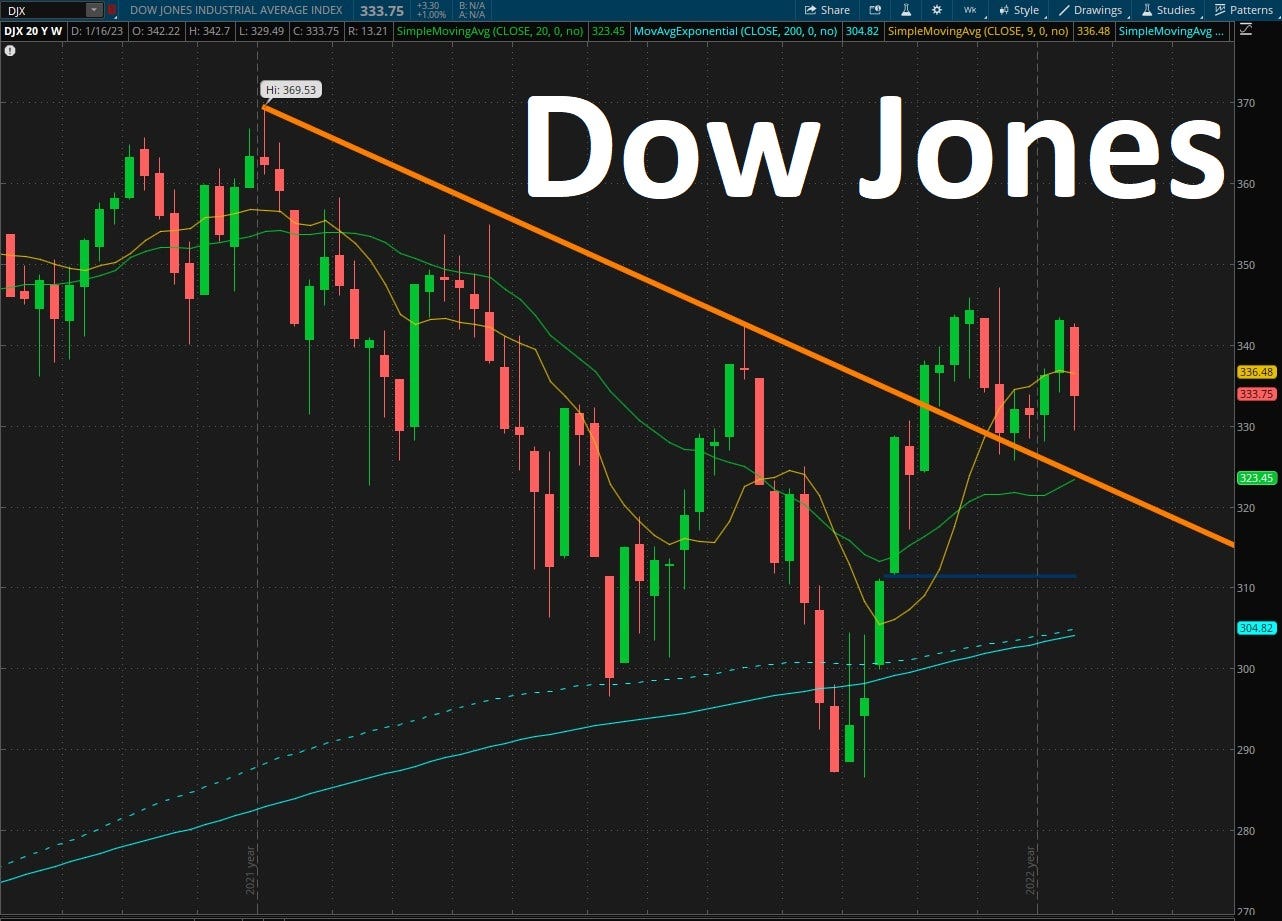
Capital goes to where it is treated best. I think it’s why the Dow Jones already broke out of the major 2022 bearish trend line in November. It is composed of fewer, more mature companies that fare better in recession, especially compared to the NASDAQ.
In light of these considerations, that long dated UDOW put I grabbed several months ago doesn’t make much sense anymore, and I might cut it loose soon. Long Dow/short NASDAQ would have made much more sense in hindsight. The weekly RSI indicator I’ve settled on since then would have saved me from buying it as well. Lesson learned.
Catching Falling Knives
I’ll wrap up with a note on a small but lame attempt to catch a bounce on Tesla. It absolutely cratered last year. Check out the head and shoulders formation on the monthly chart.
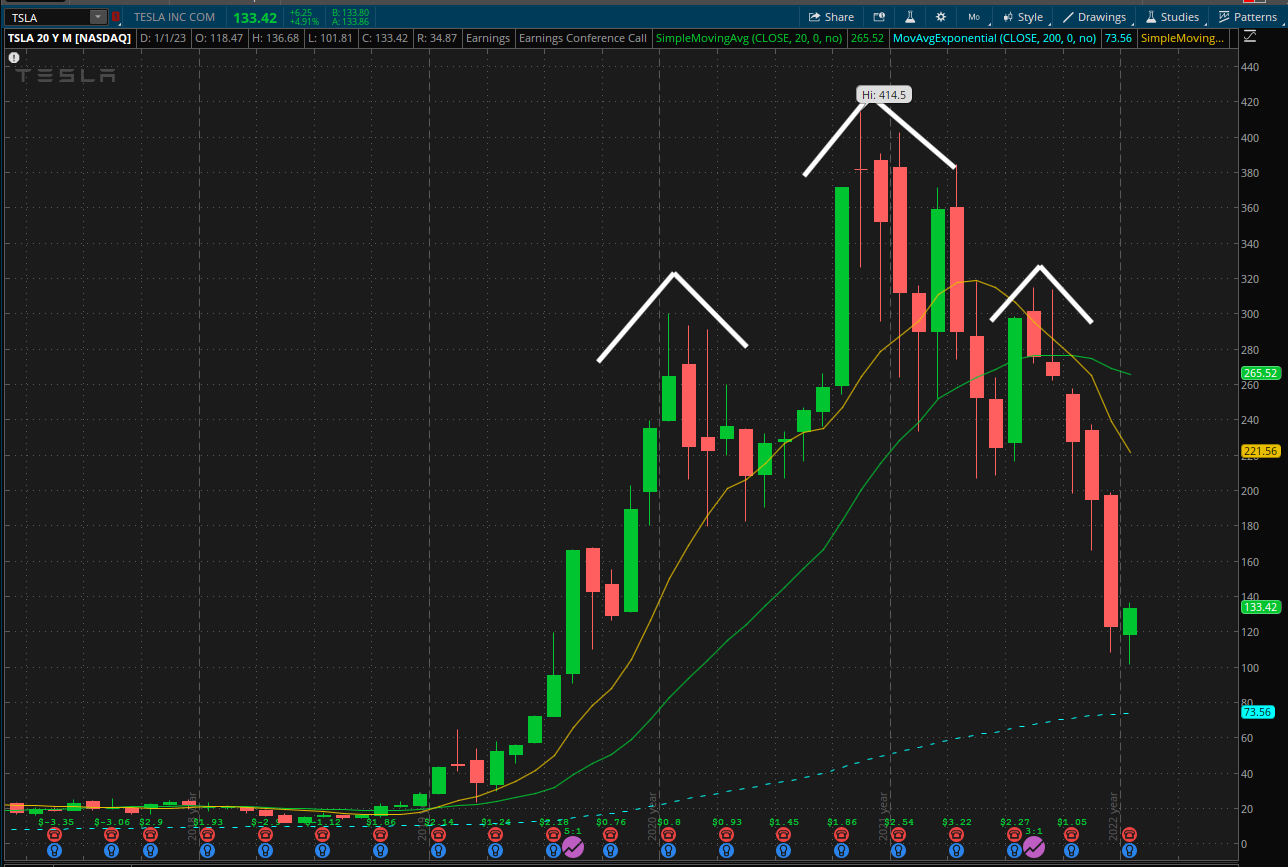
Combine rate hikes, recession, and a founder poised to dump tons of shares to buy another company, and I think we can look back to April and say this should have been the most obvious short in the megacaps.
Anyway, I couldn’t resist and bought some shares and more affordable TSLL calls at multiple strike prices expiring in mid February for a swing trade. Turns out the $130 lows of the big breakout candle from November 2020 wasn’t resistance after all. I’ve already begun to close parts of this trade at just above break even and will probably be completely out before earnings this Wednesday.
Welcome New Subscribers
Thanks to David and Alan for referencing my previous post. There was another influx of subscribers. Just a quick note on what a plan to do with this substack. As I’ve said previously, I write it primarily to organize my thoughts and research for my own learning. Putting something in writing forces clear thinking. If I benefit from it, hopefully others will too. I want to set an additional goal: write paywall-worthy content, but without the paywall - because I’m not ready to commit to any regular schedule of writing. So while I apologize for the erratic posting, it will probably always be that way.
*Disclaimer: This post discusses investment ideas but is not a personalized investment recommendation. Readers are responsible for their own research and risk assessment decisions when investing.*